


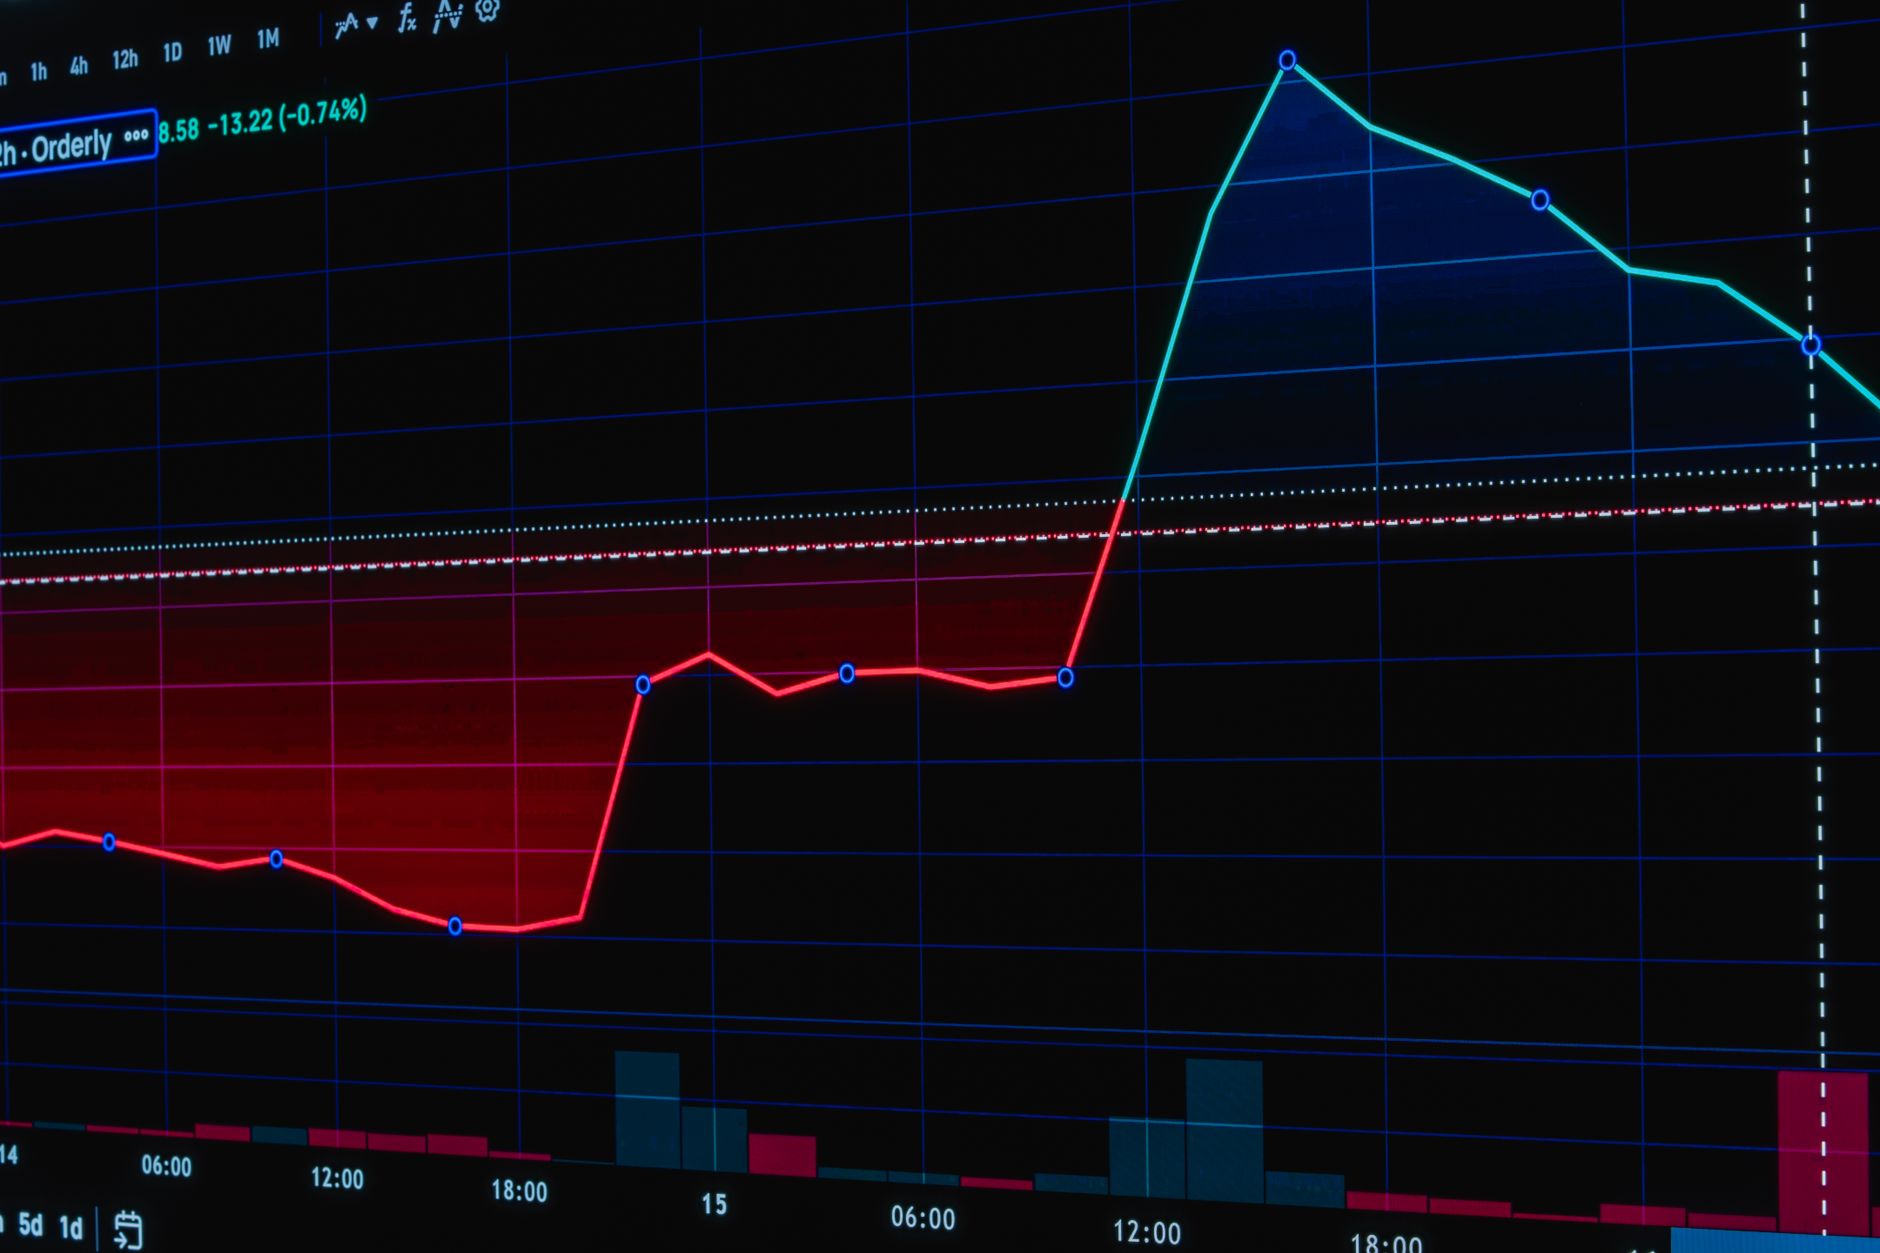
The Indian stock market concluded the week with significant gains as both the Sensex and Nifty rallied more than 2% on Friday. This performance enabled the Nifty to record its best weekly gain in five years, climbing 8% to close at 25,030. Simultaneously, the Sensex surged 1,718 points to finish the session above the 81,028 mark. This market-wide rally occurred even as broader market segments experienced a dip, and global indices faced pressure following shifts in the international political landscape.
Sudeep Shah, Vice President and Head of Technical & Derivatives Research at SBI Securities, noted that the Nifty has staged a powerful recovery, rising nearly 13% over the preceding 20 trading sessions. This upward move has resulted in a marked improvement in the index's technical structure. The benchmark successfully broke out above a downward-sloping trendline that had previously connected highs from February 3 and August 3. Having closed above this breakout zone, market observers suggest a potential shift in the prevailing trend.
Technical indicators further underscore this positive outlook. Nifty is currently trading above its primary short- and long-term moving averages, which have begun to turn upward. Additionally, directional movement indicators reveal a bullish crossover, with buyers maintaining a firm grip on the market. The daily Relative Strength Index (RSI) reclaimed the 70 mark for the first time since October 2025, and the index has consistently closed above the upper Bollinger Band for five consecutive sessions—a sign often associated with the early stages of a strong trending phase.
Addressing the specific performance of HDFC Bank, analysts highlighted that the stock has recorded a double-bottom neckline breakout on daily charts. This, paired with a downward-sloping trendline breakout, points to a structural improvement. The bank’s RSI also moved above its own downward-sloping trendline, signalling strengthening momentum. Given these technical configurations and a positive outlook from the MACD indicator, experts believe the stock is well-positioned to sustain its recent gains.
While large-cap indices have dominated the recent market narrative, mid and small-cap stocks have also shown signs of a rebound. The Midcap Index recovered nearly 10% from its late October low of 55,101. Historical data provides an encouraging backdrop for this segment, as November has historically proven to be a favourable month, yielding positive returns in 15 of the past 20 years. Technical analysis places the immediate resistance for the Midcap Index in the 61,100 to 61,200 range.
Similarly, the Smallcap Index staged an 8.75% pullback from its swing-low zone of 17,400 to 17,200. This region had previously acted as a pivotal support area, leading to a significant rally earlier in the year. Although the recovery has met resistance after moving above the 61.8% Fibonacci retracement level of its preceding decline, the underlying momentum remains a key area of focus for investors.
Looking ahead, market participants are monitoring the 24,800 to 24,750 range, which is expected to serve as a crucial support zone for the Nifty. According to technical analysis, as long as the index maintains its position above the 24,750 level, the short-term bullish outlook is expected to remain intact. Analysts emphasize that the immediate challenge for market participants is to ensure that the current momentum persists through the upcoming sessions, allowing for continued stability after recent consolidation phases.







Comments